Adsense Leaderboard

Sunday, September 16, 2012

GBPUSD Forecast (16 Sep 2012)

I’m back!  I’ve been away from trading for so long that I can hardly believe all the huge moves I’ve missed!  Nonetheless, trading opportunities are always around.  Thanks to the prodding of my friend Soon Chye, I’m looking at my charts again.

Might be alittle rusty from the downtime, but here it is… my view on GBPUSD.

GBPUSD 8H Chart

image

Even with the current USD weakness, the charts seem to imply that a short opportunity is coming soon. Here’re the reasons I see for preparing a short.

  1. The move is clearly parabolic, and it is common for parabolic moves to retrace.
  2. I’m counting the end of a corrective wave up.  Even though the moves are somewhat parabolic, it does look corrective with its overlapping waves
  3. It is approaching a significant resistance level (30 Apr High), and a round figure (1.6300)

Reasons for holding back:

  1. I think there’s going to be a pull back and then a higher high before the move retraces.  I still don’t see an divergence on the 8h and 4h at this point.
  2. I can’t get a good count on the final v wave, which looks like it still has one more wave to go.

There’s still a short term opportunity for trading.  If you are able to watch the charts, I’m fairly sure that even if price does break 1.6300, you will still achieve a nice bounce (probably 30-50pips) off that level.

Good luck with your trading!

Wednesday, August 15, 2012

Trading Psychology: Don't Trade With Your Ego

Elliott Wave Junctures editor Jeffrey Kennedy talks about "the elephant in the room" that no trader can ignore.
By Elliott Wave International

Senior Analyst Jeffrey Kennedy is a busy man. Along with his regular duties at Elliott Wave International, he prepares 3-5 video lessons each week that teach technical traders how to anticipate -- and act on -- trading opportunities.

Subscribers say that what sets Jeffrey's educational service apart is his unique ability to combine easy-to-understand, actionable advice along with a no-nonsense, uncensored look at trading psychology.

Of course, Elliott Wave Junctures is full of useful charts and technical tips. Yet some of Jeffrey's most priceless content is his straightforward discussion of the problems that most traders face -- but few experts talk about.

When I asked Jeffrey about one such lesson that resonated with his subscribers (we call it his "Patience and Persistence" episode), here's what he said:

I think that hit home because it was honest -- someone is finally talking about the elephant in the room.

Patience. Because of modern society, everything is "instant gratification." Mobile communication, fast food, you name it. Whenever you're counting waves, there's a tendency to rush the wave count. It's something that you'll always have to be on guard against. That's why I insist on confirming price action. When the pattern is indeed done, it will tell you it's done. When you're not patient, you tend to want to pick tops and bottoms.

Persistence: Just because things don't unfold exactly the way you want doesn't mean you're wrong. If you ask for a raise, and you only get 60% of what you asked for, that's not a failure. What's important is the movement; the general trend; your overall assessment of motive wave vs. corrective wave.

Being able to top-tick or bottom-tick the market is ego trading, and it'll cost you.

In my mind, there's nothing in the world that's worth anything that doesn't take a little bit of patience and persistence to achieve. A relationship, an education or career, a healthy body: how do you get these things? You keep working at it; you keep showing up every day.


14 Critical Lessons Every Trader Should Know

Learn about managing your emotions, developing your trading methodology, and the importance of discipline in your trading decisions in The Best of Trader's Classroom, a FREE 45-page eBook from Elliott Wave International.

Since 1999, Jeffrey Kennedy has produced dozens of Trader's Classroom lessons exclusively for his subscribers. Now you can get "the best of the best" in these 14 lessons that offer the most critical information every trader should know.

Find out why traders fail, the three phases of a trader's education, and how to make yourself a better trader with lessons on the Wave Principle, bar patterns, Fibonacci sequences, and more!

Don't miss your chance to improve your trading. Download your FREE eBook today >>

This article was syndicated by Elliott Wave International and was originally published under the headline Trading Psychology: Don't Trade With Your Ego. EWI is the world's largest market forecasting firm. Its staff of full-time analysts led by Chartered Market Technician Robert Prechter provides 24-hour-a-day market analysis to institutional and private investors around the world.

Thursday, July 19, 2012

See today's top 5 FX trading opportunities; join sought-after FX strategist for free webinar (exclusive invitation inside)

Hi folks!  Sorry for the long down-time.  My computer at home has died so, I’ve stopped trading and blogging for awhile and focus on other things in the meantime.

Then I saw that Elliott Wave International was providing a free webinar!  And having been a supporter of EWI for a long time, let me tell you that this is very rare.  Rare enough for me to be writing this post at work to let you know. 

Here is the invitation!


Exclusive invitation for active FX traders

Our friends at Elliott Wave International have invited you to a free webinar with one of the most sought-after FX trading strategists in the world. OnWednesday, July 18 at 1 p.m. (Eastern time), learn how he called recent declines in the euro-dollar and see his 45-minute presentation titled "How to Trade the Top 5 Forex Opportunities Right Now."

Seating is limited to the first 1,000 active traders. Reserve your seat now.

At the time this email was sent, there were just 376 seats left.


Dear Trader,

On July 6, the EUR/USD fell to a new 2-year low.

The reason for the drop?

From a fundamental standpoint: nothing.

  • There were no new devastating reports out of Europe to explain the euro's weakness.
  • Nor good economic news from the U.S. to explain the dollar's strength.
  • Nothing other than the "eurozone worries "…which, frankly, have been with us for what, two-plus years now?

In other words, market fundamentals failed to give FX traders a tell-tale signal that a drop to a new low was imminent.

At least one technical analyst did see the drop coming in his charts and alerted his readers to the move with enough time to act.

Update For: Wednesday/Thursday, July 4/5
Posted On: Tue, 03 Jul 2012 14:57:51 GMT
EURUSD Last Price: 1.2605

[Topping] The impulsive but incomplete decline from near 1.3500 and the corrective recovery during the first three weeks of June dictate a bearish outlook. From below 1.2744, and ideally below 1.2693, the euro should resume its decline.

(Excerpted from Jim Martens' Currency Specialty Service, provided by Elliott Wave International.)

EWI Senior Currency Strategist Jim Martens is one of the most sought-after FX strategists and trading instructors in the world. His technical, Elliott wave approach to the FX markets has been featured in numerous forex publications including ForexPros, FX Street, Trading Stocks and others. Jim has spoken at several trading events including The Traders Expo and Traders' Library Trading Forum.

Take this unique opportunity to learn from one of the world's top FX strategists. Follow this link to reserve your seat for his free webinar now.

Friday, June 29, 2012

How to Build Consistent Trading Success

EWI's senior analyst Jeffrey Kennedy shares with you practical advice on what it takes to improve the quality of your trades.
By Elliott Wave International

You've heard it all before:

  • If you want to trade using Elliott wave analysis, to succeed you first need to understand its rules and guidelines.
  • You need a clearly defined trading strategy (what? when? how? etc.) and the discipline to follow it.
  • Additionally, your long-term success depends on adequate capitalization, money management skills and emotional self-control.

Do you meet these qualifications, yet still struggle in the markets? If so, you may find some helpful advice in this quick trading lesson from Elliott Wave Junctures editor Jeffrey Kennedy:

We all know that the Elliott Wave Principle categorizes 3-wave moves as corrections and, as such, countertrend moves. We also know that corrective moves demonstrate a stronger tendency to stay within parallel lines, and that within A-B-C corrections the most common relationship between waves C and A is equality. Furthermore, we know that the .618 retracement of wave 1 is the most common retracement for 2nd waves, and that the .382 retracement of wave 3 is the most common retracement for 4th waves.

Knowing that all of these are traits of countertrend moves, why do traders take positions when a pattern demonstrates only one or two of these traits? We do it because we lack patience. We lack the patience to wait for opportunities that meet all of our criteria, be it from an Elliott wave or another technical perspective.

What is the source of this impatience? It could be from not having a clearly defined trading methodology, or not being able to control emotions. However, I think impatience stems more from a sense of not wanting to miss anything. And because we're afraid of missing the next big move, or perhaps because we want to pick up some lost ground, we act on less-than-ideal trade setups.

Another reason traders lack patience is boredom. That's because -- and this may sound odd at first -- "textbook" Elliott wave patterns and ideal, high-probability trade setups don't occur all that often. In fact, I have always gone by the rule of thumb that for any given market there are only 2-3 tradable moves in your chosen time frame. For example, during a normal trading day, there are typically only two or three trades that warrant attention from day traders. In a given week, short-term traders will usually find only two or three good opportunities worth participating in, while long-term traders will most likely find only two or three viable trade setups in a given month, or even a year.

So as traders wait for these "textbook" Elliott wave patterns and ideal, high-probability trade setups to occur, boredom sets in. Too often, we get itchy fingers and want to trade any chart pattern that comes along that looks even remotely like a high-probability trade setup.

The big question then is, "How do you overcome the tendency to be impatient?" Understand the triggers that cause it: fear of missing out, and boredom.

The first step in overcoming impatience is to consciously define the minimum requirements of an acceptable trade setup and vow to accept nothing less. Next, feel comfortable in knowing that the markets will be around tomorrow, next week, next year and beyond, so there is plenty of time to wait for the ideal opportunity. Remember, trading is not a race, and over-trading does little to improve your bottom line.

If there is one piece of advice I can offer that will improve your trading skills, it is simply to be patient. Be patient and wait for only those textbook wave patterns and ideal, high-probability trade setups to act. Because when it comes to being a consistently successful trader, it's all about the quality of your trades, not the quantity.

Developing patience isn't easy -- yet, if you are serious about improving the quality of your trades, it is vital.

How much more successful would you be if you could develop the patience to act only on high-probability trade setups?


Jeffrey Kennedy shares his 20 years of wisdom in analysis and trading -- to help you decide when to act -- in a new FREE report, 6 Lessons to Help You Find Trading Opportunities in Any Market.

This report includes 6 different lessons that you can apply to your charts immediately. Learn how to spot and act on trading opportunities in the markets you follow.

Get Your Free Trading Lessons Now >>

This article was syndicated by Elliott Wave International and was originally published under the headline How to Build Consistent Trading Success. EWI is the world's largest market forecasting firm. Its staff of full-time analysts led by Chartered Market Technician Robert Prechter provides 24-hour-a-day market analysis to institutional and private investors around the world.

Monday, June 25, 2012

EURJPY Forecast (25 Jul 2012)

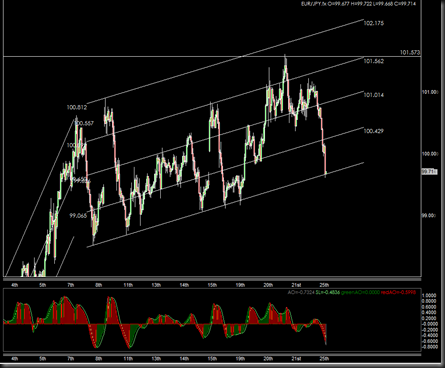
Prices have tumbled down as expected, though alittle faster that I thought.  Prices are now at the bottom of the channel line again.  This is a good time to pay attention to the price action.
image

Sunday, June 24, 2012

MeltUp: The Beginning Of A US Currency Crisis

The documentary proves through facts and statistics how hyperinflation in the U.S. is now inevitable and how Americans could soon see the end of entitlement programs they have become dependent on to live and survive. NIA believes Meltup is the most important economic documentary ever produced in world history and a must see for you, your friends, and family members.

Meltup features Gerald Celente, Peter Schiff, Ron Paul, Marc Faber, Jim Rogers, Tom Woods, and others.

I think the documentary has some interesting points, although I’m not sure I fully agree with all of the views. Keep an open mind as you watch, but also keep your critical faculty active. Enjoy!

Saturday, June 23, 2012

Kiva Free Trials

This has absolutely nothing to do with trading.  And I think that all of us should give back to the community in one way or another.  In spite of what’s happening in our lives, if we were to look deeper, I’m sure we all have things to be thankful for.

I’m a support of Kiva.org, here’s a description of Kiva lifted off their website:

We are a non-profit organization with a mission to connect people through lending to alleviate poverty. Leveraging the internet and a worldwide network of microfinance institutions, Kiva lets individuals lend as little as $25 to help create opportunity around the world.

There are many charitable organizations around, and one reason why I support Kiva is because I see that the people on kiva are people who are working to improve their own lives.  I’m definitely less inclined to contribute to the less fortunate who have victim mentality.

If you are keen to give this a try, there’s an anonymous donor who is supporting this free trials. 

Click here to give Kiva a try at no cost.  When you sign up via this link, I’ll know that you have signed up via my referral… I receive absolutely nothing, except the satisfaction I’ve made a little contribution to this effort.

And just in case you need some evidence that I’m doing this myself, my kiva profile can be found here.

Let’s make a difference. Smile 


About Kiva Free Trials

What better way to try Kiva than to try it for free? Invite your friends while supplies last. Free trial loans are available to the first new users who join Kiva through this promotion and make a free trial loan.

These free trials will be financed by friends of Kiva, allowing the new lender to make one $25 loan free of charge. These free trial loans are disbursed to borrowers in the same way other loans are disbursed on Kiva. However, since the sponsor is funding the free trial loan, any repayment funds from the free trial loan will go back to the sponsor, not to the free trial lender. New lenders invited during the promotion may choose to use their own funds to make a loan, in which case repayments will go back to the lender.

Supplies of free trials are limited to one (1) per new user, and will be made available on a “first claimed” basis.

EURUSD Forecast (23 Jun 2012)

The recent price movement for EURUSD and AUDUSD looks very similar, indicating that price movements are probably due to the USD.  However, at larger timeframes the two currency pairs are very different.

1h Chart

image

I’ve not been sure of the EURUSD, and the waves unfolding has been challenging.  So, I’ve decided to put a few wave counts into it.  My preferred wave count is in white, alternate counts are in yellow and red.  These are independent of each other.

In either case, I think there’s further downside in the short term, and I’m looking for shorting opportunities around 1.2610 level which happens to be the 50% retracement level of wave 3, and 1.381 extension of wave a.

AUDUSD Forecast (23 Jun 2012)

It’s the weekend again.  Time to take a step back and look at the charts from ground up.  I’ve learnt that during the week, I can end up looking at the smaller timeframe and lose track of the larger time frame, and the weekend is a good time to recalibrate.

Weekly Chart

image

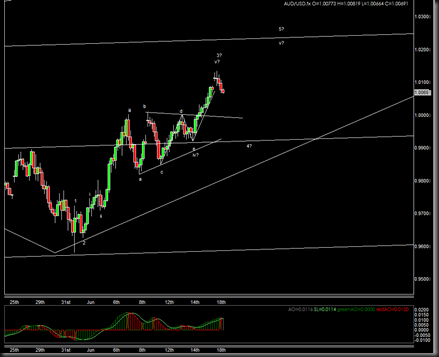
Prices have been moving up strongly and nicely as predicted in the longer timeframe.  Nothing yet in this timeframe to make me change my mind.  That’s expected though, since it’s a long timeframe…. so if it’s wrong, it will take a longer time too.  A reason why I look at the lower timeframe too.

1h Chart

image

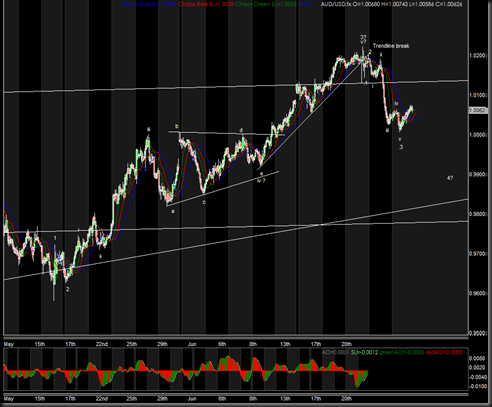
Here’s the 1h chart.  Please ignore the near horizontal lines cutting across the charts.  The lines drawn on the weekly timeframe becomes abit haywire in the lower timeframe.

It looks like a decline has started. There’s a trendline break, and the move down looks fairly impulsive.  Meaning we might be having a zig-zag for a correction.  My alternate count is that my wave 3, is in fact wave 5, and we are looking at a larger decline.  Either way, my short term view is for this to go lower.

1h Chart

image

I’ll be looking to go short at the 50%-61.8% retracement levels – see the shorting area on my chart.  Those levels also happen to coincide with some natural support and resistance levels.  Once the corrective move up unfolds in a more countable A-B-C pattern, then we can have a more precise entry level target.

Stop loss will be about 100-125 pips away behind the peak of the high.  I’ll keep my size small.  Once price confirms, I’ll lower the stop loss and increase my position size to manage my risk.

Good luck with your trading!

Friday, June 22, 2012

EURJPY Trade Triangles (22 Jun 2012)

Some of you know that I’m testing the Trade Triangles from INO Market Club.  I think they make a good add-on, although the signals don’t come all that often (after all, overtrading can kill you too.)

There’s been a new Trade Triangle for EURJPY.  If you had been following my EURJPY Forecast, you know that I’ve been fairly cautious of this pair due to volatility, however, price rejected off the bottom of my corrective channel as I predicted and made it’s merry way up.  I was cautious and had taken profit early.

The INO Marketclub now has a nice Trade Triangle for EURJPY, fairly hot off the oven.

image

The signal is for a long at 100.90, and it appears that a fractal high has been broken, so it does make for a logical location for a long position.  Looking at the technicals of the daily chart, you will need a fairly large stop loss. Or if you wish to be conservative, you can place it at the low of the signal bar.

Let’s watch and see.

European Debt Crisis: "Imagine the Worst and Double It"

Just how will the sovereign debt crisis end?
By Elliott Wave International

We've all heard the line: Let me give it to you straight.

And in speaking to his counterparts in Spain, an Irish economist did just that.

Ireland has this banking advice for Spain: imagine the worst and double it. [emphasis added]

Like Ireland, Spain sought a bank bailout after being felled by a real-estate crash. Now, just as the Irish did, the Spanish are awaiting the results of outside stress tests gauging the size of the hole in the banking system.

Bloomberg, June 14

Stress test or no, EWI's Global Market Perspective has known that Spain's banking system is frail. In May, the publication gave its subscribers this chart-supported insight:

A 17-year high in the percentage of non-performing Spanish loans is merely one illustration of the Continent's illness. After falling to a four-decade low of less than 1% in 2007, delinquencies have spiked eightfold in the past five years. The percentage stands at its highest level since 1994.

Global Market Perspective, May 2012

By itself, a subsidiary of Spain's largest bank, Banco Santander, absorbed Q1 bad loan losses of 475-million euros.

Italy is in the same sinking economic boat. The June Global Market Perspective showed how much the eurozone's third largest economy is also drowning in bad debt.

The Italian and Spanish economies are in shambles as borrowing costs have skyrocketed for both countries.

But the recent spotlight has been on Greece. Now that the Greek election is over and voters appear ready to embrace austerity, should we be optimistic about the future of the euro zone?

You owe it to yourself and your investments to find out. Remember, even if you believe you're not directly invested in Europe, there's a very good chance that some of the companies in your portfolio are.


Get Ahead of What Is Still to Come in This FREE Report from Elliott Wave International

The debt crisis in Europe continues to play out in the political, social and financial worlds. What will be next? With commentary and analysis from February 2010 through today, this timely report gives you an important perspective on the European debt crisis and what it could mean for your portfolio.

Read Your Free Report Now: The European Debt Crisis and Your Investments >>

This article was syndicated by Elliott Wave International and was originally published under the headline European Debt Crisis: "Imagine the Worst and Double It". EWI is the world's largest market forecasting firm. Its staff of full-time analysts led by Chartered Market Technician Robert Prechter provides 24-hour-a-day market analysis to institutional and private investors around the world.

Wednesday, June 20, 2012

USDMXN Trade Triangles (20 Jun 2012)

This is not Elliott Wave, I’m sampling the Trade Triangle Signals from INO Market Club. And there’s one that just popped right up which my broker provides.  Definitely an exotic pair, but good for observation.


image

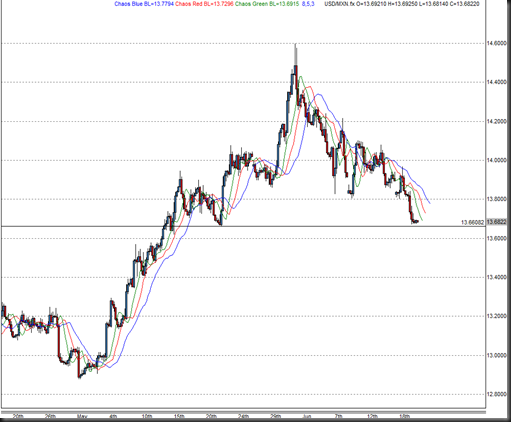
The signal is at 13.7883 to go short.  How to read the signal is simple, go short on the weekly triangle after a daily triangle.  (For shorter timeframe).  Unfortunately, the stoploss is left to you.  So can place it above the previous pivot high of 13.9617, and let it run.

Here’s what it looks like on my charting software:

1h Chart

image

Price is stalling around the support region, and the overall trend seems to be downwards. if one wants to go short, I would suggest going short around the 13.800 level, that’s how I would play it.

For now, I’m just observing how good this trade triangle is.  If you want to give it a try, you can do so at here at a promotion price of $8.95 for the first month.  Else wait here for my updates.  :)

So, anyone keen to take this trade?

Risk of Investing in the Euro | Kathy Lien on Business News Network


Tuesday, June 19, 2012

EURUSD Forecast (19 Jun 2012)

I am looking for a shorting opportunity for the EURUSD, and this may just be it.

15min Chart 

image

Prices have made a nice retracement of 61.8%.  It is around the 1.618 extension of the first rally up.  Price is around the S&R level due to the price gap. 

So we can place a trade here, and there are a few places you can place the stop:

a) Put a stop above the wave  ii high – about 1.2725.
b) If you want to be more conservative, you can place the stop just above the wave i low – 1.2672. 
c) A possible alternate wave count is that wave ii was in fact the wave 2 which unfolded as an expanded flat.  Then you would place the stop just above wave 1 – 1.2704.

Alternatively, you can wait for price to confirm, i.e. make a series of lower lows, before you enter.  Of course, that means you get in short at a level price level.

Fingers crossed… (I’m crossing my fingers quite abit lately, aren’t I?)

EURJPY Forecast 2 (19 Jun 2012)

Here’s a quick follow-up.  EURJPY has made a nice rally.  I would take partial profits off, to ensure that if price reversed, I will still be positive, or at least break even.  Now I can sleep better tonight.  :)

image

Stay safe in your trading!

EURJPY Forecast (19 Jun 2012)

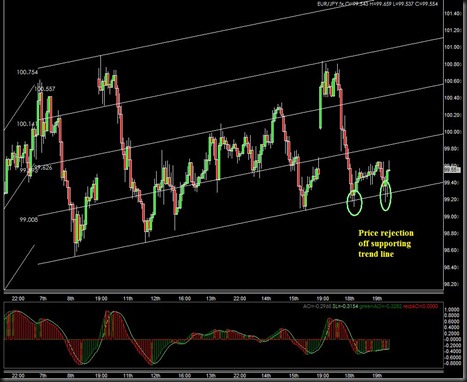
Still being extremely cautious with this pair.  It’s been range bound (about 50pips) for the past few hours. Prices seem to be respecting the supporting trending, which suggest that the channel may still be effective.  Any break downwards would give me a bias to go short.  For now, I’m long with a small stop (below the low of 99.06) with a small position.

1h Chart

EURJPY 1H 19 Jun 2012

Many people telling me to stay short….. Fingers crossed now…..

Euro at Clear Risk but Trading Conditions Difficult | DailyFX (Video)

By David Rodriguez, Quantitative Strategist


Here's a nice video by DailyFX on the EUR.  David talks about the Greece Fundamentals with some nice stats from Bloomberg, correlation charts, COT Charts and other interesting stuff.

Monday, June 18, 2012

EURUSD Forecast (18 Jun 2012)

I’ve revised my view on the EURUSD so many times, I’m almost embarrassed. haha! Prices have broken the high of my wave A, but price movement is so overlapping, I’m extremely reluctant to count that as a wave C. So I’m counting that as a wave b rally of an expanded flat. I might be pushing it somewhat… but here’s the chart!

4h Chart

image

EURJPY Forecast (18 Jun 2012)

Challenging times for wave counting.  Here’s my view on EURJPY

8H Chart

image

On the 8h timeframe, it looks like there’s still another wave down that’s waiting to unfold.  The recent rally looks to be a corrective one, and has stagnated at the S&R level of 100.80. Wave count suggest that it can probably still go higher (about 101.50-102.00 region for first target), but the price weakness is a concern and needs to be watched carefully.

1H Chart

image

As mentioned at the start of this post…. wave count is challenging.  So I’m looking at the overall picture first.  The rally is nicely bound by channel lines, suggesting that the rally is a corrective one (which it should be for a wave 4).

There are two sets of channel lines where the gradient of the second set appears much gentler. Again, this suggests that price may be losing strength in this rally.  However price-wise, I am expecting prices to go higher as per the 8H chart above. 

Adopting a wait and see approach for now.  Meanwhile, can trade smaller timeframes, and other price patterns like the gap that just occurred over the weekend. (Of course, it’s too late to take the trade now.  Good luck for those who went short earlier! )

AUDUSD Forecast (18 Jun 2012)


Daily Chart

image

On a larger timeframe, prices are going up nicely as forecasted late last month. I think it may have a ways up to go before coming back down. We can draw nice channel lines which bounds the price movement. Let’s take a look at the smaller time frame.

4H Chart

image

Please ignore the lines.  They are the same lines from the daily chart, just that they look more confusing when we zoom in.  I’m counting the middle segment of overlapping waves as a running triangle.  That’s the best count I can come up with the wave structure I’m seeing.   Can look to trade the AUDUSD Long for the wave 5 if it retraces back.

I am finding the wave structure difficult to count this period, so I’m keeping my losses tight and my trading conservative by taking profits along the way.

Thursday, June 14, 2012

EURUSD Forecast (14 Jun 2012)

I know I’d been saying that prices will go higher in this correction.  And as the waves unfolded, I’m becoming increasingly uncomfortable with the earlier count, and am now opting for a different count.  This count however, would suggest a rather different prices movement.

Here’s the wave count:

1h Chart

image

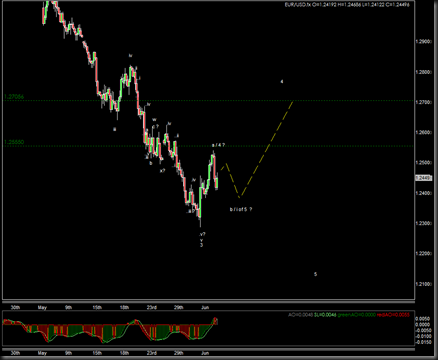
The decline after the gap has been far too strong.  An although at the lower timeframe it is challenging to count the 5-wave subdivisions, I’m now going to opt for this count.  The entire move up, is in fact a a-b-c move upwards, with a diagonal for the wave c.

Wave A has been completed with that gap up which completed the diagonal.  The subsequent strong decline then begins a wave a of B.

If wave b of B is completed (the recent rally), then perhaps the price action that is coming will looking something like this:

image

A decline to around the 1.2380 level, followed by a rally of a similar magnitude of wave A, leading to around the 1.2770 level.

Alternate Count

The alternate count is that the entire wave A is in fact the wave 4 correction, and the wave a of B that I’m counting is in fact the start of a larger degree decline for wave 5.

Stay alert, as the Greece Elections on 17th Jun, and the upcoming news releases may produce some fairly wild swings.

Dollar falls, euro touches $1.26

I just saw this news article from MarketWatch.com - "Dollar Falls, Euro touches $1.26".  It's worth a read if you want to look at some of the fundamentals or mindsets that's pushing the currencies around.

But for anyone that has been following the charts, the price movement is old news. Euro had touched $1.26 last night while I was asleep (we all need our beauty sleep right?) and made a pull-back from it.  The rally doesn't look very strong, but I'm expecting prices to be able to go higher still.  There's a series of major economic news coming out today (source: ForexFactory) that may cause some wide swings:


3:30pmCHF
Libor Rate
<0.25%
<0.25%
3:30pmCHF
SNB Monetary Policy Assessment
3:30pmCHF
SNB Press Conference


8:30pmUSD
Core CPI m/m
0.2%
0.2%
8:30pmUSD
Unemployment Claims
377K
377K


* Note: Timings above are based on Singapore time (GMT+8)

Good luck with your trading!

Wednesday, June 13, 2012

Listen: EWI's Chief Analyst Hochberg Explains Recent Action in Stocks, U.S. Dollar and More

Listen to Hochberg explain the problems with using lagging economic indicators like earnings - By Elliott Wave International

EWI Chief Market Analyst Steven Hochberg talks with MarketWrap radio on May 10, 2012, about recent market action and where we are in the long-term trend, among many other topics.

Listen to Hochberg explain why using lagging economic indicators like earnings as a forecasting tool is like driving down the highway while looking in the rear-view mirror.

Enjoy this free audio clip -- and then take advantage of a limited-time offer to learn even more about EWI's big-picture forecast for U.S. and Europe (see offer details below).


When the markets were still going up at the beginning of 2012, were you warned that they would soon go down?

Elliott Wave International has just made its May 2012 Elliott Wave Financial Forecast available FREE for a limited time. No one should invest a dime in U.S. or European markets until they read this 10-page report at least 3 times. With a $29 value, this single issue of the May 2012 Elliott Wave Financial Forecast will give you the complete big-picture forecast for U.S. and Europe -- financially, economically and socially.

Get up to speed and ahead of the markets today. Download your free 10-page report now >>

This article was syndicated by Elliott Wave International and was originally published under the headline Listen: EWI's Chief Analyst Hochberg Explains Recent Action in Stocks, U.S. Dollar and More. EWI is the world's largest market forecasting firm. Its staff of full-time analysts led by Chartered Market Technician Robert Prechter provides 24-hour-a-day market analysis to institutional and private investors around the world.

USDJPY Forecast (13 Jun 2012)

Looks like there’s another triangle in the making for USDJPY.  I’ll be watching this, and have set an alert for a price breakout upwards, and for it to hit my expected wave e completion.

image

Triangles are usually continuation patterns, so I’m expecting prices to break upwards upon completion.

EUR/USD Classical Technical Report 06.12 | DailyFX

Here's a Technical Analysis on the EURUSD by DailyFX, looking for a short term correction up to 1.2800-1.3000 levels.  It's somewhat higher than what I'm looking at with my wave counts, but not impossible.  I'm still looking at shorting opportunities around 1.2770-1.28000.

EUR/USD Classical Technical Report 06.12 | DailyFX

Lien, Maloney, Sebastian on Investing in the Euro

Although the overall trend for the EUR is down, the price action has been pretty choppy lately.  Bloomberg has Kathy Lien on Fundamentals, Bill Maloney on Technicals, and Mark Sebastian on options.

Enjoy!

http://bloom.bg/MwMOco

Tuesday, June 12, 2012

EURUSD Forecast (12 Jun 2012)

With the nice price movements, I’ve now revised my count somewhat.  I’ve been warned that gaps usually close, (yes I knew that…).  Anyway, here’s the new count on the 1 hour.

1H Chart

image

I am still counting the gap up as a beginning of the wave C for this retracement.  Although prices are dangerously close to invalidating my wave counts. So if the low of my wave B is taken out, it may be time to review the whole count again.

Alternatively, the whole thing could be unfolding as some sort of diagonal triangle right now.

Monday, June 11, 2012

EURUSD Forecast (11 Jun 2012)

Hope everyone is doing well with your trades.  I’ve been away and had not been able to follow the markets closely for the past 4 days.   And it’s interesting to see how prices have unfolded since my last post on EURUSD.

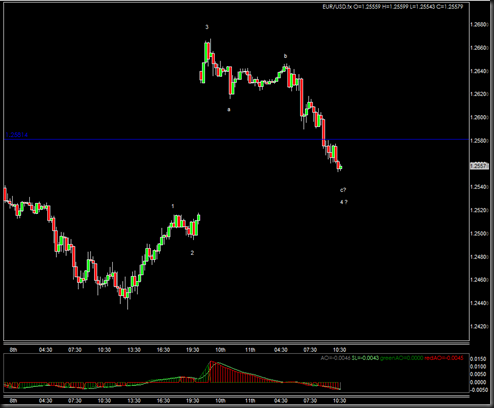
Prices have retraced nicely, and then spike up strongly.  It has since slowly trailed downwards.  Here’s a 4h Chart:

4h Chart

image

Let’s drill down.

1h Chart

image

15min Chart

image

I’m expecting a 5-wave move for wave C.  So here are my expectations of the markets based on this wave count.

a) This decline will not go below 1.2516 (wave 1 high)
b) The current high of 1.2661 will be taken out before the low of 1.2435
c) Once prices turn, I’ll start looking for possible areas where wave 5 of this correction is ending. Currently, based on a Wave C = Wave A projection, that price level is around 1.2770.

I’ll be looking for the markets to tell me if I’m correct or not.  Meanwhile, stay safe while trading!

Saturday, June 9, 2012

Four reasons why the euro will survive

I was reading CNNMoney this morning and came across this interesting article.  I have not really taken a side on this because I trade mainly technicals.  Many of you may be interested to read this article.

Personally, this is what I thought was interesting.  I had always thought that Germany would be unhappy with supporting the Eurozone and would want to get out, but the article implies that doing so would in fact harm Germany.... hmm... interesting....

Here are the 4 reasons in brief:

  1. It's too painful to breakup (even for Germany)
  2. Euro area voters are risk averse
  3. The euro is innovative and a work in progress 
  4. The European Central Bank can handle the crisis


Friday, June 8, 2012

Always be first in line, stay updated!

Did you know that there are several ways to ensure that you get updated with the latest forecast or offers? 

image If you look to the right side of the page, you will see several buttons.

You can click on
-  “Join This Site”,
- Subscribe by email, or
- even subscribe to the RSS Feed so that you can read it in your favorite reader.

And if you find the content here interesting, please click on the “like” button so that I know there’re still readers like you out there!

Thanks!

EURUSD Forecast (8 Jun 2012)

Here’s a quick 4h Chart.  I think the corrective rally is well in place. Overall trend is still bearish.

4H Chart

120608 EURUSD 4H

Safe Trading!

Thursday, June 7, 2012

AUDUSD Forecast (7 Jun 2012)


In my AUDUSD Forecast (23 May 2012), I indicated that the AUDUSD decline may be ready for a rally.  Since then, prices have shot up strongly suggesting that may wavecount may be in effect.

Weekly Chart

image

The strong green candlestick suggest that we may be having a rally starting.

15min Chart

image

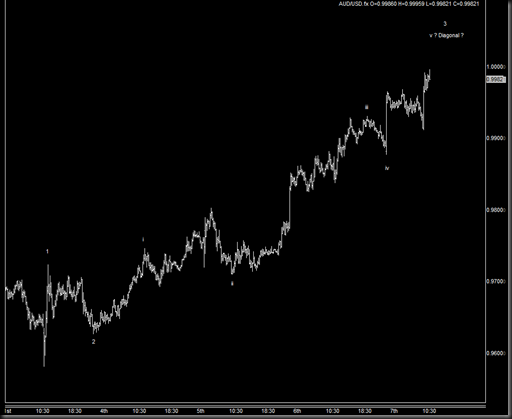
I’m counting the wave upwards as impulsive waves.  Looking at a wave v to be completed before I see a wave 4 decline.

Free Trend Analysis

You know that I’m an Elliott Wave Trader, and you’ve seen all the wave counts I’ve put up on the blog.  Some are correct, some are wrong and need a re-count, and most people find Elliott Wave way too complex to trade with.

As a trader myself, I’m also on a constant lookout for different modes of trading, and the INO Market Club has some interesting features that you may be interested in. (Access the INO Website here)

  1. Free Trend Analysis at the website.  All you have to do is enter the currency pair at the top right hand corner of the screen, and then click on “Analyze” when the chart comes up.  Here’s one I just pulled up for EURUSD.  It doesn’t give you details of its back-end formula, but I think it’s a good indication of trend.
    image
  2. Free Trading Tools and Education. They have some interesting offers on their website as well.  Naturally, some of them appears to be a means to market the products to you, but I think some of the items like the free SFO Magazine is a really good deal.

If you like what they are providing free on the website, you may also be interested in their Trade Triangles Proprietary Indicator.  Unfortunately, you will need to pay in order to use it or even review it. Fortunately, I’ve already stepped through the door, and will show you a snapshot of how one is to trade using that indicator.

(I’m probably not supposed to make this public since you need to pay to use it, but I’ll just do it ONCE here for your benefit.)

Here’s the EURUSD Chart which I had been analyzing (Click here for my EURUSD Forecasts).

120607 EURUSD Trade Triangle

You can see that the trading signals don’t come all that often, and the lowest timeframe for the indicator appears to be daily (I could be wrong and need to explore more).  In terms of effort, it’s almost effortless, just screen for the signals and take them when they come.  I think it’s a good way to supplement my Elliott Wave counts, but many people can probably trade the indicator on it’s own, and it’s much simpler than counting waves.

Visit the MarketClub  to find out more. Enjoy exploring the website, and I’ll be sure to post if I find more interesting stuff.

Safe Trading!

Wednesday, June 6, 2012

USDCHF Forecast (6 Jun 2012)

Daily Chart

image

Looking at the daily chart, I still think that the rally is a wave B rally in an expanded flat, which means we can start looking for nice shorting opportunities once the rally is complete.

4H Chart

image

On the 4h chart, my preferred count is that we have completed wave v of 3, and are in the process of a wave 4 decline.  The decline while strong looks very much like a 3-wave structure. And since it is a wave 4 decline, I’m expecting a deeper retracement to correct the entire wave 3 structure.

15min Chart

image

Down to the 15min chart now.  Even at the 15min chart, the decline looks corrective.  And it looks like we have a 5 wave up for a wave a of (b).  My view of the short term is a rally to around the 0.9685 region where we can look for shorting opportunities.

If you are feeling adventurous, you can look at taking a long position when price makes a higher high, with a stop below the low of wave (a) around 0.9570. Remember though, that in the daily timeframe, there’s a long pin bar which may indicate a larger decline in the longer time frame.

Immediate-Term Bias : Bullish
Medium-Term Bias : Bearish

Safe Trading!

The 80/20 Trade: "Pounce Like a Cat"

Patience Can Be Rewarding
By Elliott Wave International

Copy the tiger when stalking and capturing a "pounce-ready" trade.

Tigers know the prey they covet is elusive: they show great patience and care when stalking the target.

I came across this description of the tiger's technique:

"When hunting, this cat...may take twenty minutes to creep over ground which would be covered in under one minute at a normal walk...the tiger will sometimes pause...move closer and so lessen that critical attack distance...before finally raising its body and charging.
"...they wait until a victim comes close and spring up...This ambush method of hunting uses less energy and has a greater chance of success."

You must "ambush" high confidence trades. Long-time professional trader and teacher Dick Diamond says patience is vital before the ambush.

I talked to Diamond about his famous 80/20 trade, which he means literally -- he says it has at least an 80 percent chance of success. It's the only trade set-up Diamond will take.

------------

Q: Could you tell me about the 80/20 trade?

Diamond: The 80/20 trade is based on indicators that create a specific trading set-up. A trader must act on this set-up immediately. You must wait, and then pounce like a cat when the opportunity presents itself. Then you set stops. In shorter time frames, like trading from a five minute chart, the 80/20 set up may come along a few times a day. If you're trading a longer time frame, like off of a 120 minute or 240 minute chart, the 80/20 will come along less frequently, but when it does, the opportunity will be bigger. The 80/20 trade can be especially rewarding for position traders. Sometimes the indicators reveal what I call 90/10 or even 95/5 trades.

Q: What emotional factors do students need to work on the most?

Diamond: Traders must be calm and confident. You can't be a Nervous Nellie and succeed at trading. Calmness comes from learning the proper trading techniques.

Q: What's different about trading today vs. when you started out in the 1960s?

Diamond: When I started trading, execution took up to five minutes -- now it takes less than a second. Time is money, so computers provide a great advantage to today's trader compared to pre-computer days. At the same time, while computers allow the trader to see multiple indicators on the screen, one must avoid indicator overload. One must learn to narrow down the number of indicators.


Get instant access to our FREE report from Veteran Trader Dick Diamond

In this 12-page report, you will learn practical tips and tricks from veteran trader Dick Diamond.

He and his assistant, Roberto Hernandez, share many of their time-tested techniques with you, with excerpts from interviews and course materials designed to accelerate your trading progress.

Download your FREE 12-page report today >>

This article was syndicated by Elliott Wave International and was originally published under the headline The 80/20 Trade: "Pounce Like a Cat". EWI is the world's largest market forecasting firm. Its staff of full-time analysts led by Chartered Market Technician Robert Prechter provides 24-hour-a-day market analysis to institutional and private investors around the world.

Tuesday, June 5, 2012

EURUSD Forecast (5 Jun 2012)

Hi everyone, getting pretty tied up with many things this few weeks so am not able to do much analysis on my charts. Here’s a quick one of the EURUSD

4h Chart

image

There’s a very sharp rally in the EURUSD as seen in the chart.  I still doubt that the decline is over, but my wave count suggests that a wave 3 decline might be over, so a wave 4 is probably in effect right now.  I shall wait for the wave count to clarify itself. In the meantime, the dotted yellow line is an indication of how I think prices may be moving.