Due to work commitments, I’ve stopped looking at the markets for quite awhile. I’ve decided to come back and pick this up again. For a start, I’m going to try my hand at the AUDUSD chart.
Looking at the Weekly Chart.
I was counting the sharp impulsive drop from July 2008 as a larger degree wave (1) as it looks very much like an impulse wave. However, the recent high has broken its starting point so it could very much be a wave (A) instead. Even if we were to assume it was a zig-zag, zig-zags typically does not make a new price high.
Nonetheless, I’m counting its ascend as a corrective wave, where we have completed a wave 4 expanding triangle and am now wave 5.
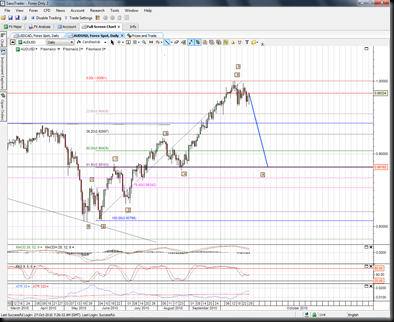
below is my wave count for wave 5 on the daily.
I’ve broken one cardinal rule in my wave counts (wave 4 overlaps wave 1), so I am somewhat cautious that my count is wrong. Regardless, here’s what I have.
My suspicion is that AUDUSD would not break parity as yet. Instead, it would retrace to around wave 4 of the lesser degree, which also corresponds to a 61.8% fib level. In addition, it is also a significant support and resistance level.
In short (no pun intended), I’d short AUDUSD if it rose back to around 0.9950 to keep my risk level low. And if it goes to around 0.8820 I’ll look to go long.
Good luck with your trading!


