Adsense Leaderboard

Thursday, May 31, 2012

EURUSD Forecast (31 May 2012)


1H Chart

image

Prices for EURUSD like the one for USDJPY has made a nice run down.  I find the waves for EURUSD getting more difficult to count, but I suspect that the wave has not yet completed its 5 waves.

There’s a rounding bottom reversal, and price looks quite strong on the upside.  I’ll be cautious and take partial profits, or exit all together and look for new opportunities.

Good luck with your trading!

USDJPY Forecast (31 May 2012)

I hope you had been happily riding the wave down after the past two entries on the USDJPY.

Price has made considerable move downwards, and I can count 5 waves of some degree completed.  This may be a good area to lock in some profits and let the prices ride.  If it it extends, that puts extra cash into the account.  But it is prudent to expect some correction after the 5 waves down.

Hourly Chart

image

Based on the post-triangle thrust measurement (see the vertical white line on the chart), price still have a ways to go.  The 5 waves down may below to an extended wave 3, which means there’s a possible correction for a wave 4, and then for prices to move back down to complete wave 5. Either way, it is good to preserve capital over being greedy for gains.

Trading the EURCHF Floor

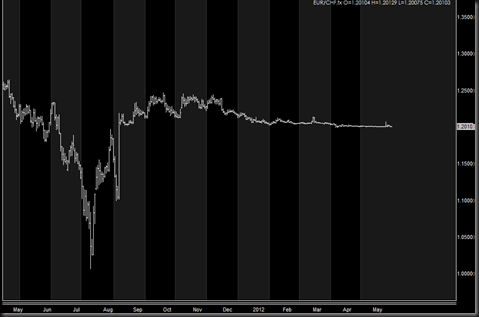
The Swiss National Bank (SNB) had set a price floor for EURCHF at 1.2000, and price is dangerously close at 1.2010 right now. Actually, it has been hovering at that price for a good many months!  Take a look at the chart here:

image

Each vertical section represents 1 month, so we can see that prices have been stagnating for many months now.  Now, EURCHF is not a currency pair that I usually trade, nor am I a fundamentals trader, so I didn’t even know about the price floor until a friend told me.

And since I know now, I thought you should know too!

If you are keen to take a position, you might want to consider going long (it’s a price floor after all). But remember, there are no guarantees in trading, so remember your risk management and position sizing too.

Here’s an April 2012 special report by DailyFX which I found:
Euro/Swiss Franc Nears 1.20, Swiss National Bank Hovers-Trade Setups?

Wednesday, May 30, 2012

EURUSD Forecast (30 May 2012)

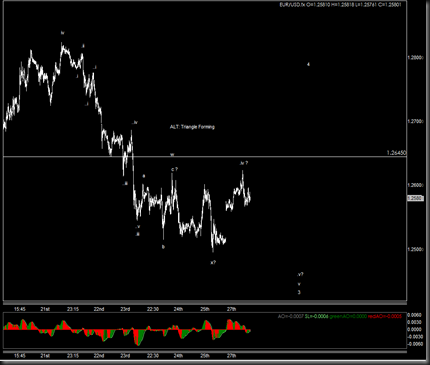
Following up on my previous wave count, it does seem like wave .iv has completed, and it’s making its wave .v down.  The only thing is, it seems to me like wave .v is sub-dividing, which means, more bearish potential. 

image

USDJPY Forecast (30 May 2012)

Here’s an update on my quick and dirty forecast on USDJPY Yesterday:

image

Prices have broken the wave d low, that my entry, and my stop is above the wave e high.  If it breaks the wave e high at this point, then the count is wrong.

If you are trading this, be cautious as I know many people who do not think USDJPY would sink much further.  Be prudent by take partial profits along the way if the trade moves your way.

Tuesday, May 29, 2012

The Big List of Behavioral Biases


From BusinessInsider.com’s article on “61 Behavioral Biases That Screw Up The Way You Think”, I decided to take a look at it’s source: Tim Richard's Psy-Fi Blog.  I found that these were actually expanded from a list of “slightly odd behaviours in the sphere of investment”.

As a part of trading psychology, and a way to better understand ourselves as traders. I think these articles are a good read. And it’s good to identify some of our own biases and guard against them.

For the full article, click on the links above, and here are my thoughts on some of these Biases.

Self-Enhancing Transmission Bias: people tell others about their successes more often than their failures, and their listeners don't take account of this.

Often times when we speak to traders, they will share their winning trades with you.  It is important to get the full picture and see both winning and losing trades.  And often times, there are more things to learn from losing trades than winning ones.  The goal is, naturally, to learn from mistakes and not make them again.

The next time someone shares their winning trade with you, ask (nicely) about all the trades the person had for the week or month.

Choice Overload: too much choice makes us indecisive.

Some people think that trading many currency pairs in many timeframes using many trading strategies is the best way to be profitable. Contrary to that, successful trades often focus on a few pairs of currencies, using only a few profitable strategies. Having too many strategies (and too many indicators in one) will likely only confuse you.

Sometimes, Less is More.

Bias Blind Spot: we agree that everyone else is biased, but not ourselves

I’m guilty of this one, and it’s important to recognize that we always have a bias. In fact, when you trade, you always have a bullish or bearish bias, why else would you trade in that direction?  But it’s important to recognize that it’s a bias, not a fact, that you are trading.


Confirmation Bias: we interpret evidence to support our prior beliefs and, if all else fails, we ignore evidence that contradicts it

Every trader has done this before – Ignore contradictory signals because he has already entered a trade.  And again, this bias often only becomes clear after the trade his a stop and becomes reality.  Here is where an opportunity to have a smaller loss is ignored, in favor or hope that other evidence which supports your trade will prevail.


Gambler's Fallacy: the mistaken belief that a run of specific results in a random process must revert.

This is the thought process behind the Martingale Money Management Strategy.  “I’ve lost 5 times in a row, the next one will be a win!” That’s the reason that gambles double their bets each time they lose in a bid to win back the losses.  Give it an unlimited number of tries, and you will have a win simply due to randomness / probability.  However, you must first have very deep pockets as doubling up each time will quickly bankrupt you.

If you risked 1% of your account for your first trade, and doubled up each time you made a loss. In a string of 5 losses, you would have lost 24% of your account!  It gets worse! In your 7th string of losses, you would have lost 96% of your entire account, and a string of 7 losses is not uncommon in trading!


And there you are! Remember, Psychology is a key pillar in trading!

USDJPY Forecast (29 May 2012)


Here’s a quick and dirty chart.  I think a triangle may be forming right now, and if the count is correct, I’m looking for a break downwards.  Take a look and make your own conclusions.  For the triangle to remain valid, prices must remain below the wave c high – 79.82.
image
If it reverses about now, the post-triangle thrust measurement goes down to around the 78.25 level.
Well, it’s really a quick and dirty analysis.  Remember to do your own due diligence when trading!

Facebook Comment Box now available!


You can easily share your comments using the new Facebook Comment Boxes!  Come share your opinions and questions, and interact with other traders here.

image

And if you like this site, please click on the facebook like button on the right of this page.

Monday, May 28, 2012

EURUSD Forecast (28 May 2012)


image

Wave .iv may be complete and wave .v could be in progress.  Watch the price and trade safely!

Saturday, May 26, 2012

USDCHF Forecast (26 May 2012)

Hi folks, it’s the weekend again! Hope everyone has something enjoyable planned out. For me, it’s time to look at the charts again and see what things might possibly go. I find the markets difficult to read, and the Euro crisis may be throwing the waves into greater strength or weaknesses across all currencies.

Let’s take a look at the USDCHF.

Daily Chart

image

Each vertical section in the chart is 1 month, so we get to see the monthly movement for USDCHF.  My preferred wave count is that we are in the middle of a complex correction, with limited upside before it makes a wave C downwards to complete it’s correction.  I’m looking at around 0.8600 where my wave 4 is for that correction.

If that’s correct, it should be making its way upwards to complete its wave (2) or (B).

The alternative wave count is that wave A is in fact the full retracement, and price is on its merry way up to far far away land from here. But the movement after preferred count wave A seems more corrective than impulsive. So that will be my alternate count.


8H Chart

image

* Each vertical segment represents 1 week in this 8h chart.

Counting up from preferred wave count A.  I’m not sure if the move up is completed.  My inclination is in fact, that wave 3 had extended, and we are merely completing wave v of 3.

So generally, looking to go long in the short term, until I see strong signs of reversal, which I will then be inclined to look for short trades in favor of a Wave C downwards.

Well, that’s my opinion of USDCHF right now.  Remember, personal due diligence, and good money management!


Elliott Wave International provides education on Elliott Wave analysis, and they provide a free 10-lesson Basic Elliott Wave Tutorial. Here's what you'll learn in the tutorial:

  • What the basic Elliott wave progression looks like
  • Difference between impulsive and corrective waves
  • How to estimate the length of waves
  • How Fibonacci numbers fit into wave analysis
  • Practical application tips for the method

      Click here to access the free 10-lesson Basic Elliott Wave Tutorial now


      Friday, May 25, 2012

      Free Elliott Wave Financial Forecast (May 2012)

      Elliott Wave International, a leading provider of technical analysis to individual investors and institutions worldwide, has just made its May 2012 Elliott Wave Financial Forecast available -- for free. This is rare: As one of its flagship publications with paying subscribers around the globe, EWI almost never gives away the Financial Forecast at no charge.

      With Europe in turmoil, U.S. stocks retreating and the mainstream financial press totally on the wrong side of the trend (as usual), EWI's big-picture forecast -- though dire -- is actually quite refreshing to read. In trademark fashion, EWI tackles the issues that everyone else ignores, and they explain the future using straight-talking language I appreciate.

      The folks over at EWI have put together a webpage to allow you to download this special issue for free, but fair warning: It's only available until Thursday, May 31.

      I could describe the report for you here, but the webpage EWI put together speaks for itself. I encourage you to follow the link below to go there, read about the report and then download it for free.

      Learn more and download EWI's new 10-page May 2012 Elliott Wave Financial Forecast here -- it's free.

      Thursday, May 24, 2012

      EURUSD Forecast (24 May 2012)

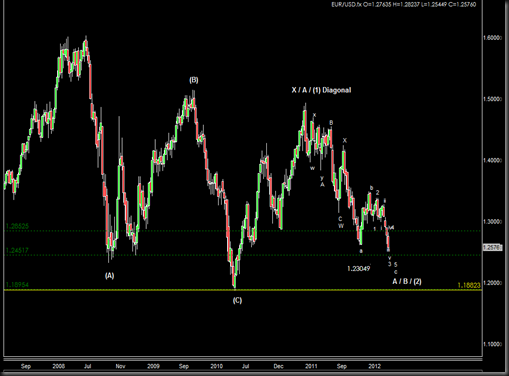
      After my session with Ray and FuzzyLogic, I decided to re-do my wavecounts all the way from the weekly timeframe down to the lower time frame.  It’s something I used to do, but I got lazy…. so here it is.

      Weekly

      image

      Daily

      image

      8 Hourly

      image

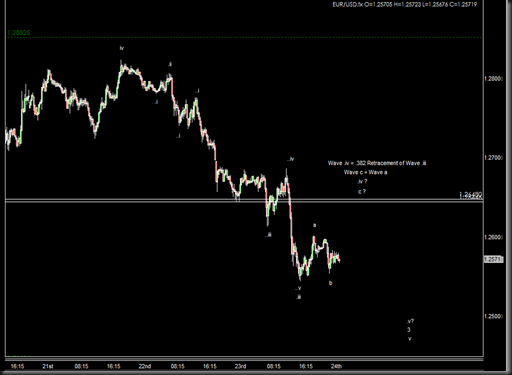
      Not much additional information from the Daily to the 8 hourly.  So let’s see if wave v of 3 is completed.  Down to the 15min.

      15min

      image

      Looks like wave 3 has yet to complete.  If wave .iii has completed, expect wave .iv to stagnate or end around 1.2650.  It has some good fibb convergence and S&R levels.

      That’s it for my wave counts.  Take care out there!

      Wednesday, May 23, 2012

      AUDUSD Forecast (23 May 2012)

      I had the opportunity to meet up with RayG and FuzzyLogic from the forums in “My Trading Room”.  Thanks for joining in!

      Both of them had a really great way of trading, and I’m thinking of making FuzzyLogic my mentor in price action trading. Haha!

      During the session, I had an extensive session with RayG on wavecounts on the AUDUSD on a weekly timeframe.  There was some different in opinion, but RayG’s inputs helped me solidify my thinking and pushed me to think of alternative wave counts!  Thanks for getting rid of my laziness!

      Forecast (Weekly Timeframe)

      Here’s the forecast:

      image

      Preferred Count

      ’m counting a complex correction for wave B on the way right now.  If wave Y unfolds and goes beyond 1.10930, that would make my entire ABC structure an expanded flat, and bring the C wave all the way down to around 0.84967 which is

      1. within the 50%-61.8% retracement, and
      2. also within the price zone of the 4th wave of the one lesser degree.

      If my preferred count is correct, we would have completed (or is completing) wave b of Y and would be facing a turn around soon. I’ll be looking for fractal breakouts in the lower time frame to enter the market.

      Alternate Count

      For the alternate count. In seat of a complex correction.  I’m counting my wave W as a completed Wave B, that makes us currently in a Wave C decline which is yet to complete.  What keeps me away from this count is that the move recent move down looks a lot more alike a zig-zig than a impulse wave downwards.

      So time will tell, and I don’t typically trade on the weekly and daily timeframe. But it gives a very good overview of the general direction for trading my lower timeframe.

      Tuesday, May 22, 2012

      How a Simple Line Can Improve Your Trading Success

      Elliott Wave International's Jeffrey Kennedy explains many ways to use this basic tool

      The following trading lesson has been adapted from Jeffrey Kennedy's eBook, Trading the Line -- 5 Ways You Can Use Trendlines to Improve Your Trading Decisions. You can download the 14-page eBook here.

      "How to draw a trendline" is one of the first things people learn when they study technical analysis. Typically, they quickly move on to more advanced topics and too often discard this simplest of all technical tools.

      Yet you'd be amazed at the value a simple line can offer when you analyze a market. As Jeffrey Kennedy, editor of the new Elliott Wave Junctures service, puts it:

      "A trendline represents the psychology of the market, specifically, the psychology between the bulls and the bears. If the trendline slopes upward, the bulls are in control. If the trendline slopes downward, the bears are in control. Moreover, the actual angle or slope of a trendline can determine whether or not the market is extremely optimistic or extremely pessimistic."

      In other words, a trendline can help you identify the market's trend. Consider this example in the price chart of Google.

      That one trendline -- drawn between the lows in 2004 and the lows in 2005 -- provided support for a number of retracements over the next two years.

      That's pretty basic. But there are many more ways to draw trendlines. When a market is in a correction, you can draw a trendline and then draw a parallel line: in turn, these two parallel lines can create a channel that often "contains" the corrective price action. When price breaks out of this channel, there's a good chance the correction is over and the main trend has resumed. Here's an example in a chart of Soybeans. Notice how the upper trendline provided support for the subsequent move.


      For more free trading lessons on trendlines, download Jeffrey Kennedy's free 14-page eBook, Trading the Line -- 5 Ways You Can Use Trendlines to Improve Your Trading Decisions. It explains the power of simple trendlines, how to draw them, and how to determine when the trend has actually changed.

      Download your free eBook >>

      This article was syndicated by Elliott Wave International and was originally published under the headline How a Simple Line Can Improve Your Trading Success. EWI is the world's largest market forecasting firm. Its staff of full-time analysts led by Chartered Market Technician Robert Prechter provides 24-hour-a-day market analysis to institutional and private investors around the world.

      How to Become a Master Trader in Record Time

      Some readers told that they found the "3 Keys To Successful Trading" extremely useful, and would like to have more write-ups on the topic. Ask and you shall receive!

      I wrote a new article titled "How to become a Master Trader in Record Time".  Well, basically, how can you shorten the time it takes for you to be successful at trading. I'll not replicate the article in this post, so here's the link:

      You can also access these articles directly from the top of the screen. Good luck with your trading!

      Thursday, May 17, 2012

      Triangles offer an important piece of forecasting information

      Triangles offer an important piece of forecasting information
      By Elliott Wave International

      There's no shortage of books about trading these days, and you could read for months before you come across one that might apply to your trading style.

      The free 45-page eBook The Best of Trader's Classroom is specifically for Elliott wave traders and saves you time in getting the knowledge you want.

      It's written by Elliott wave trader Jeffrey Kennedy: he had individuals like you in mind when he said

      I began my career as a small trader, so I know firsthand how hard it can be to get simple explanations of methods that consistently work. In more than 15 years as an analyst since my early trading days, I've learned many lessons, and I don't think that they should have to be learned the hard way.

      The Best of Trader's Classroom offers 14 trading insights that you can use now.

      Consider these examples of what you'll learn:

      • Use bar patterns to spot trading setups
      • Use the Wave Principle to set protective stops
      • Identify Fibonacci retracements
      • Apply Fibonacci ratios to real-world trading

      Jeffrey also discusses corrective patterns which includes the triangle formation. Here's an edited eBook excerpt:

      Triangles are probably the easiest corrective wave pattern to identify, because prices simply trade sideways during these periods. [The graphic below] shows the different shapes triangles can take.

      ....triangles offer an important piece of forecasting information -- they only occur just prior to the final wave of a sequence. This is why triangles are strictly limited to the wave four, B or X positions. In other words, if you run into a triangle, you know the train is coming into the station.

      Jeffrey goes on to provide three real world examples of the triangle price pattern. Here's one of them with his accompanying commentary.

      [The chart above] shows a slight variation of a contracting triangle, called a running triangle. A running triangle occurs when wave B makes a new extreme beyond the origin of wave A. This type of corrective wave pattern occurs frequently in commodities.


      Learn more about the 14 trading insights that Jeffrey Kennedy presents in The Best of Trader's Classroom.

      This chart-packed 45-page eBook has a $59 value -- but you'll get FREE instant access by simply joining Club EWI. Membership is also free and it just takes a minute or two to sign up. There's no obligation after you join.

      Just follow this link for your free download of The Best of Trader's Classroom >>

      This article was syndicated by Elliott Wave International and was originally published under the headline 14 Elliott Wave Trading Insights You Can Use Now. EWI is the world's largest market forecasting firm. Its staff of full-time analysts led by Chartered Market Technician Robert Prechter provides 24-hour-a-day market analysis to institutional and private investors around the world.

      Wednesday, May 16, 2012

      EURUSD Trade Review (16 May 2012)

      If you had been following my EURUSD forecast, I had been very excited about counting the “completion” of my five waves.  Alas, my trade was botched.  Here’s a chart of my wave counts and my entry (Green Line) and stop (Red Line).
      image
      Here’s my personal review of the trade:
      1. Was I diligent in monitoring the price movement? - Y
      2. Did I have alternate wave counts – N
      3. Did I follow my trading rules? – Y
      4. Did I follow my money management rules for individual trades? – Y
      5. Did I follow my guideline on max number of concurrent trades ? – Y (I had EURUSD, USDCHF, AUDUSD running at the same time)
      I need to be more diligent in having alternate wave counts.  Where else can I improve?
      1. Always go back to higher timeframe to look at overall wave movement.  Especially when I dig down into so many degrees / levels.
      2. One thing I’ve been thinking of including in my trading plan that I have not.  Similar to what Robert Balan proposes – If the stop is hit, enter a trade in the reverse direction (not more than the size of the initial trade).

        In his words - “The purpose of the net short position is to try to recover all or enough of the losses from the long trade so as to prevent the capital from being impaired.  A bigger stake on the downside is unjustified at this point. “
        I’m not so comfortable with entering into a trade automatically in the opposite direction as this point, but will look at how this will limit the loss incurred from the trade.

      Alright, that pretty much sums up my trades.  It’s back to the drawing board, I’ll post my next forecast when it’s ready!

      Tuesday, May 15, 2012

      EURUSD Forecast Update v2 (15 May 2012)

      There we go! I’m counting my wave 5 from hell completed as the price reversed nicely and looks fairly impulsive. Still, keep your stops tight, and watch the prices closely.

      image

      Good luck with your trading!

      USDCHF Forecast Update (15 May 2012)

      Similar to the EURUSD, I think this is a wave 5 from hell! LOL.

      If you refer to the video, the prices have sky rocketed to the trading zone identified at the daily timeframe.  And there was I silly enough to think that it would be turning soon based on the 1hourly.  Everyone knows that the higher timeframe takes precedence right?  Actually, nothing is for certain in trading, we just have to monitor the different timeframes and see which one is respected.

      Here’s the daily chart showing that prices have entered into the daily TF trading zone that I pre-planned.

      image

      But we’ll always need to look at the lower timeframe to see how it unfolds.  And it’s not pretty! Here’s the 5min.

      Can anyone say “PARABOLIC”?

      image

      Again, I find the waves expanding like crazy…. and I think there’s probably one move up left.  I’m sandwiching the price bands with alerts so I know which way it is breaking out.  I can smell this one growing ripe! 

      EURUSD Forecast Update (15 May 2012)

      Prices have entered my trading zone below 1.2870, and the strength of the move down is pretty strong! I’ve decided to look at a smaller time-frame - 5mins! (it’s a bad idea at times, I know!)
      Here’s my wave 5 from hell……
      image
      I believe wave 5 is expanding so many times, it’s making my head spin! in fact, I don’t even think it’s done yet. Yes, there’s ANOTHER leg down perhaps before it will finish its wave… boy I certainly hope so!

      Monday, May 14, 2012

      USDCHF Forecast Follow-up (14 May 2012)


      Quick follow up on USDCHF.

      image

      Upon market open, prices have gapped up above my original target reversal zone, and I’m revising my count to a expanded wave 5.  I’m going to monitor this closely.

      Sunday, May 13, 2012

      USDCHF Forecast (12 May 2012)


      Here’s my very first attempt at doing a video.  It’s (largely) unedited, but I think it gets the job done. :)
      Let me have your feedback as comments.  I know it is rather messy… but it’ll get better!
      Good luck with your trading!

      Updates:
      14 May 2012 Update - Price Gapped on Monday Market Open. Wave 5 Extended.

      Saturday, May 12, 2012

      EURUSD Forecast (12 May 2012)

      Hi Folks, it’s been a long while since I put up any forecast.  Here’s a quick and dirty on my thoughts on the EURUSD.

      image

      On the 8h Chart, I’m counting a Wave C of Y of (B).  Prices have returned to below 38.2% of its upward move, and Wave (B) looks like a complex correction.  Prices are overlapping enough for me to believe that it is a corrective move, and strength of downward movements appear rather strong, so I will be cautious in entering long.  But I do think that prices might be stalling soon.  Here’s why:

      Around 1.2900 region we have:
      (a) Wave Y = Wave W
      (b) Wave c = Wave a
      (c) Round Figure of 1.2900

      Let’s look at my wave C at a lower timeframe.

      image

      It seems that momentum has been slowing down and is getting more difficult to count which is fairly characteristic of wave 4. I think it will move up a little before breaking 1.2900.  I would look for reversals around 1.2864-1.2875.

      It is possible for prices to move up from here since the higher timeframe suggests that 1.2900 is a confluence of levels, but I think it will move lower before the move down is complete.

      Here you go, be cautious with your trading, and remember, capital preservation is key!